
Cape Cod Market Update November 2019
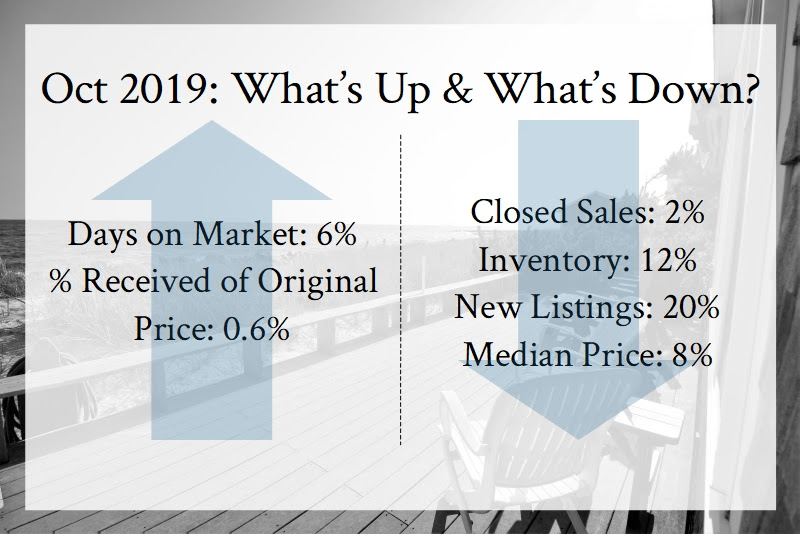
<p><img alt="https://campaign-image.com/zohocampaigns/369239000002508004_zc_v18_market_update_oct_2019.jpg" class="featured featured featured" src="https://ci3.googleusercontent.com/proxy/FVGYkm8y5uLA8LoGFXNGjZ05_uSxcYXkJ8F4sNUtHuhUBbpM9hBv9joFzy9Zze_ZYz9gzIAxNcAH7K4-_SGnM5uvaCyOjQeE7UmeX-1eM1kru_EdM82V2NfUxiJgdSAG9go83C5VqQWZP3Cb3I70-w=s0-d-e1-ft#https://campaign-image.com/zohocampaigns/369239000002508004_zc_v18_market_update_oct_2019.jpg" style="height: 267px; width: 400px; margin: 9px; float: right;" />In October Barnstable County saw more of the fall slowdown with a significant reduction in new listings compared to this time last year. Additionally new listings are down 5% year-to-date continuing the trend of historically low numbers of homes for sale. Despite this the October market largely kept pace finishing with 5.7 months supply of inventory available. Remember that 6 months is the magic number for a sustainable market between buyers and sellers. Single family homes have not seen significant gains in median price since June and the affordability index has gained 20% since the start of the year signaling good news for buyers. In addition continued low mortgage rates (~3.625% at time of writing) helps buyers looking to get into the market. </p>
<p> We will continue to keep our eyes on the amount of inventory as well as the months of supply available Cape-wide. However we can't stress enough how the entire County is not representative of market niches.</p>
<p> </p>
<table align="center" border="1" cellpadding="10" cellspacing="10">
<caption>
<h2>Recent Market Summary</h2>
</caption>
<tbody>
<tr>
<td style="text-align: center;"> </td>
<td style="text-align: center;"> Aug </td>
<td style="text-align: center;"> Sept </td>
<td style="text-align: center;"> Oct </td>
</tr>
<tr>
<td style="text-align: center;"> Closed Sales </td>
<td style="text-align: center;"> 382 </td>
<td style="text-align: center;"> 339 </td>
<td style="text-align: center;"> 379 </td>
</tr>
<tr>
<td style="text-align: center;"> Inventory </td>
<td style="text-align: center;"> 2,082 </td>
<td style="text-align: center;"> 2,090 </td>
<td style="text-align: center;"> 1,975 </td>
</tr>
<tr>
<td style="text-align: center;"> Median Sales Price </td>
<td style="text-align: center;"> $431K </td>
<td style="text-align: center;"> $452K </td>
<td style="text-align: center;"> $440K </td>
</tr>
<tr>
<td style="text-align: center;"> Avg Days on Market </td>
<td style="text-align: center;"> 90 </td>
<td style="text-align: center;"> 98 </td>
<td style="text-align: center;"> 103 </td>
</tr>
<tr>
<td style="text-align: center;"> Avg % of Original Price </td>
<td style="text-align: center;"> 94% </td>
<td style="text-align: center;"> 94% </td>
<td style="text-align: center;"> 94% </td>
</tr>
</tbody>
</table>
 In
October Barnstable County saw more of the fall slowdown with a
significant reduction in new listings compared to this time last
year. Additionally new listings are down 5% year-to-date
continuing the trend of historically low numbers of homes for
sale. Despite this the October market largely kept pace
finishing with 5.7 months supply of inventory available.
Remember that 6 months is the magic number for a sustainable market
between buyers and sellers. Single family homes have
not seen significant gains in median price since June and the
affordability index has gained 20% since the start of the year
signaling good news for buyers. In addition continued low
mortgage rates (~3.625% at time of writing) helps buyers looking to
get into the market.
In
October Barnstable County saw more of the fall slowdown with a
significant reduction in new listings compared to this time last
year. Additionally new listings are down 5% year-to-date
continuing the trend of historically low numbers of homes for
sale. Despite this the October market largely kept pace
finishing with 5.7 months supply of inventory available.
Remember that 6 months is the magic number for a sustainable market
between buyers and sellers. Single family homes have
not seen significant gains in median price since June and the
affordability index has gained 20% since the start of the year
signaling good news for buyers. In addition continued low
mortgage rates (~3.625% at time of writing) helps buyers looking to
get into the market.
We will continue to keep our eyes on the amount of inventory as well as the months of supply available Cape-wide. However we can't stress enough how the entire County is not representative of market niches.
| Aug | Sept | Oct | |
| Closed Sales | 382 | 339 | 379 |
| Inventory | 2,082 | 2,090 | 1,975 |
| Median Sales Price | $431K | $452K | $440K |
| Avg Days on Market | 90 | 98 | 103 |
| Avg % of Original Price | 94% | 94% | 94% |